
The Log is a timekeeping tool and data visualizer.
The Log is a tool used for daily productivity logging and data visualization. Its data can be found in the sidebar of all project pages logged in it (including this one).
I've written about the Log and my thoughts on time tracking here, after tracking my productivity every day for the last 9(!) years.
The Log is a long-running project that's gone through many iterations as a result of my evolving ideas around simplicity.
It began as a .txt file formatted more or less like a .csv, which was later transferred into an SQL database and visualized with PHP (code repository found here), which was deprecated in favor of a more streamlined pipeline using google sheets, which was abandoned when I began to escape the google ecosystem and replaced again with a .csv file and an implementation in obsidian with the sqlseal plugin (code repository found here).
The data format has thankfully stayed consistent.
DATE        TIME  PROJECT      TASK            DIVISION   DETAILS
2017.08.30  1.0   V-OS         Development     Visual     Testing new headers.
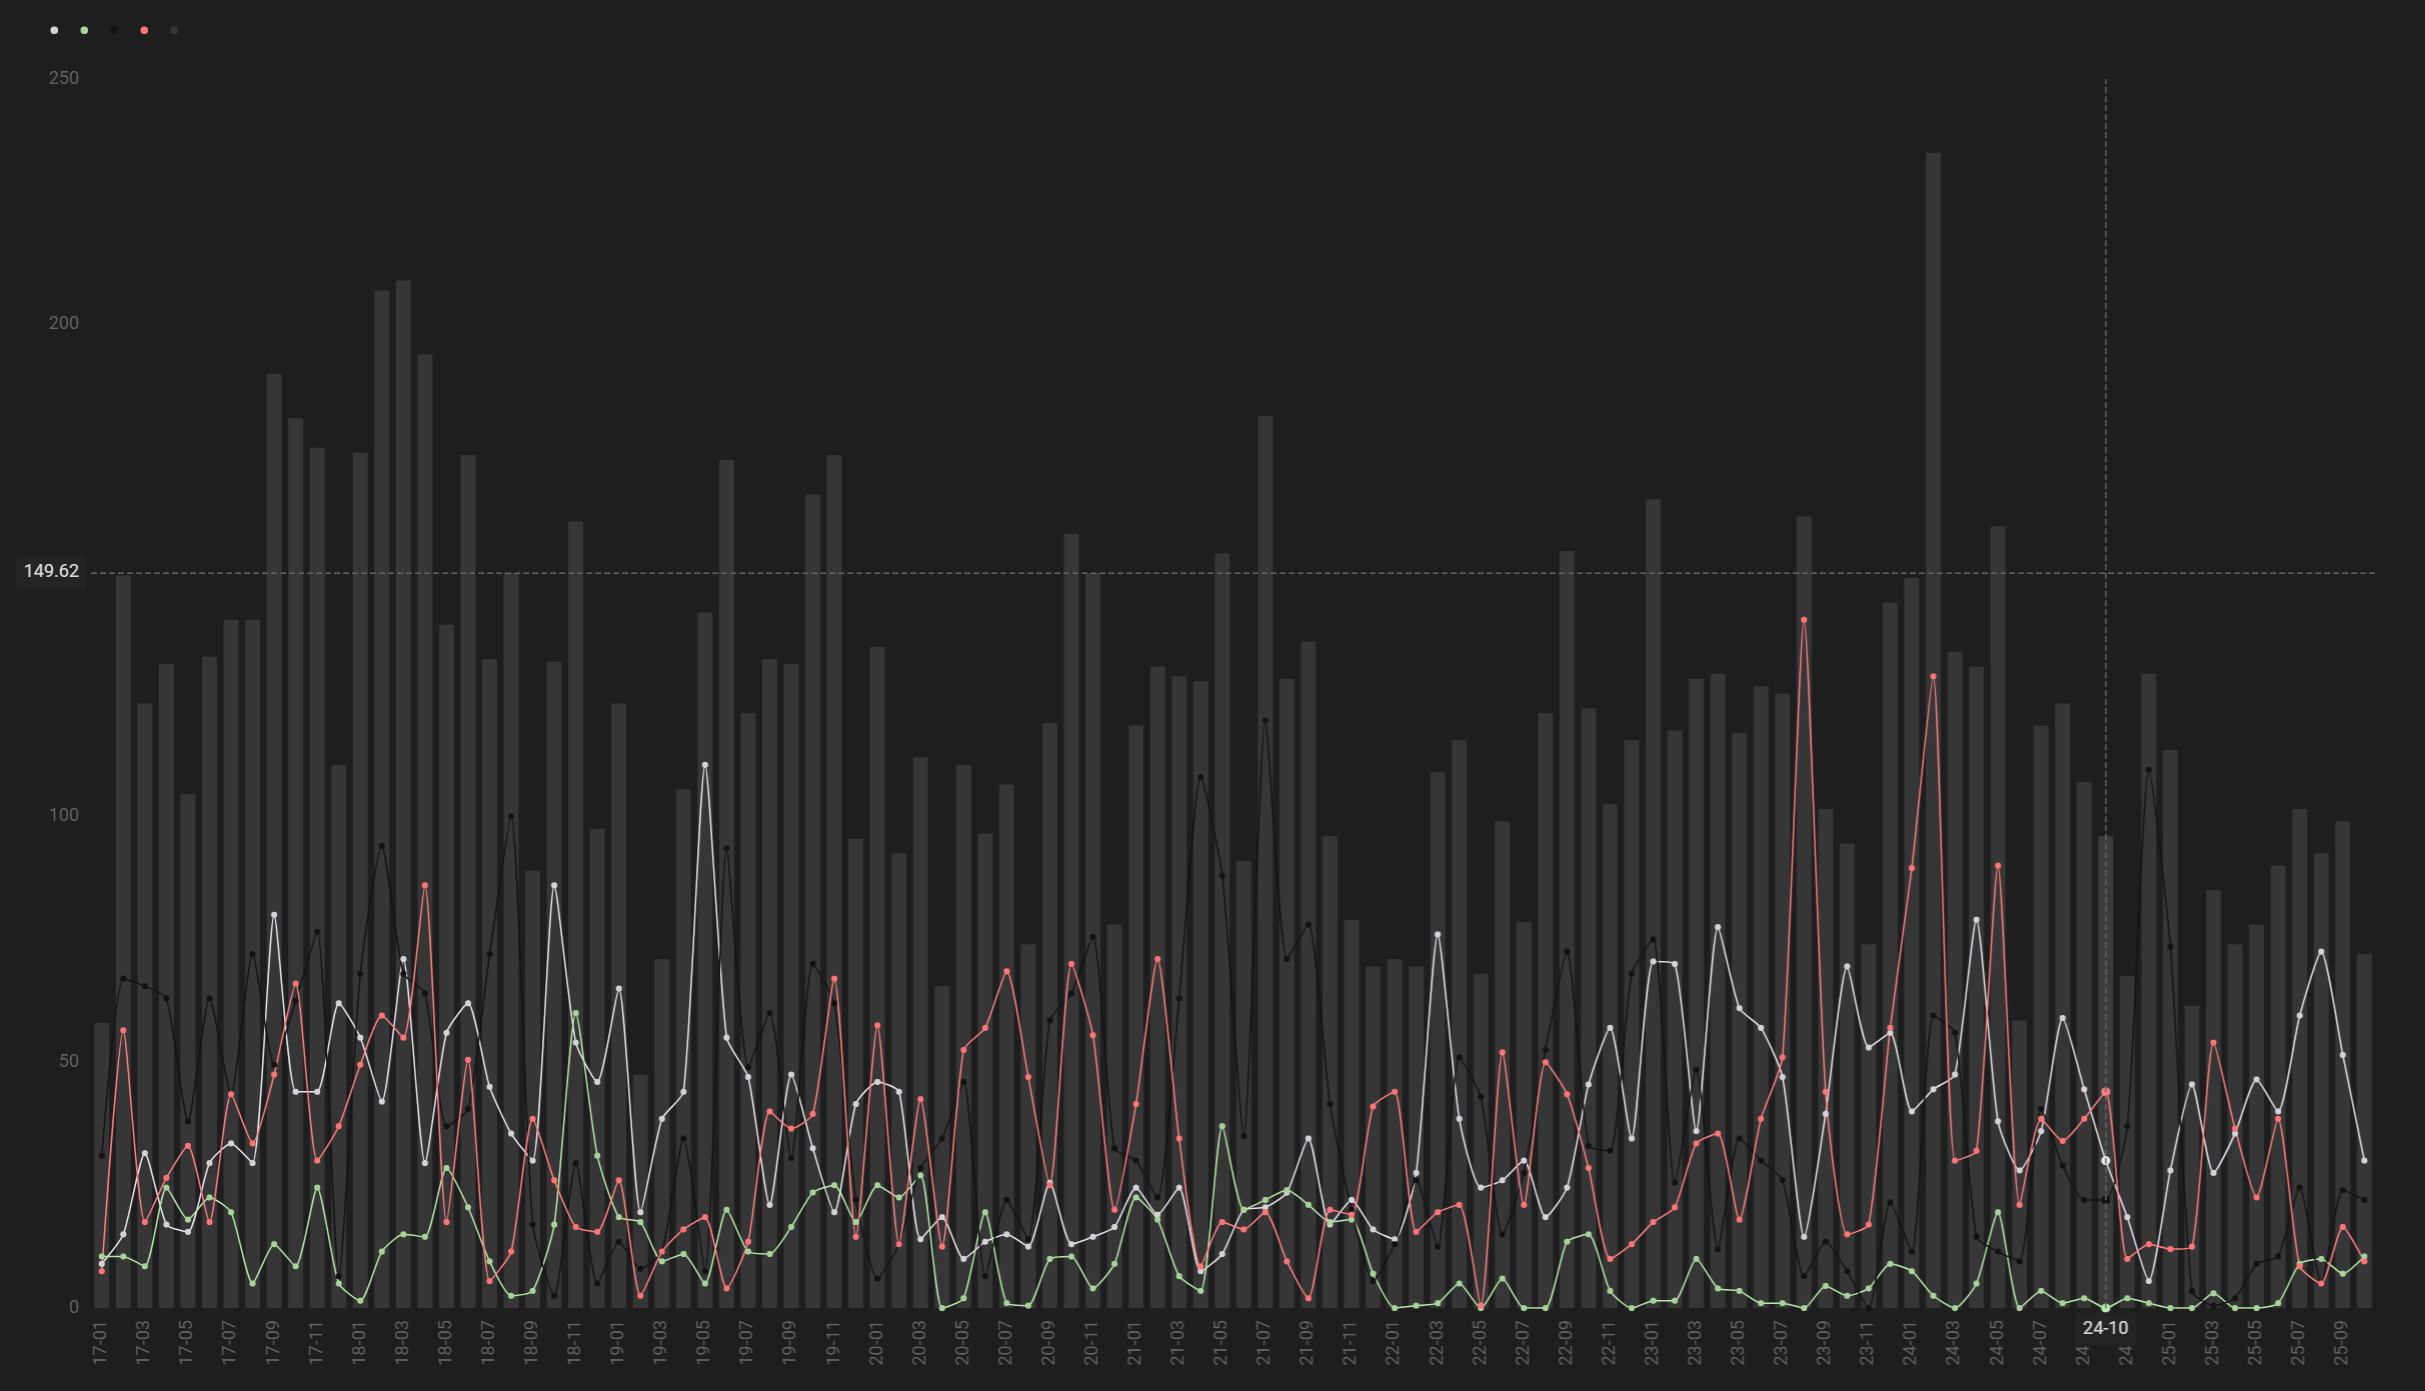
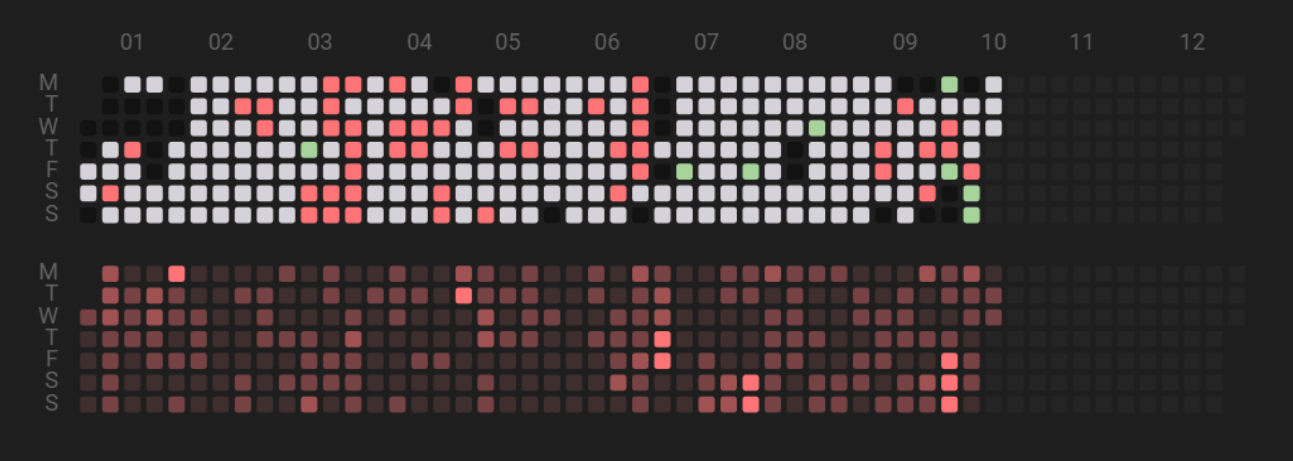
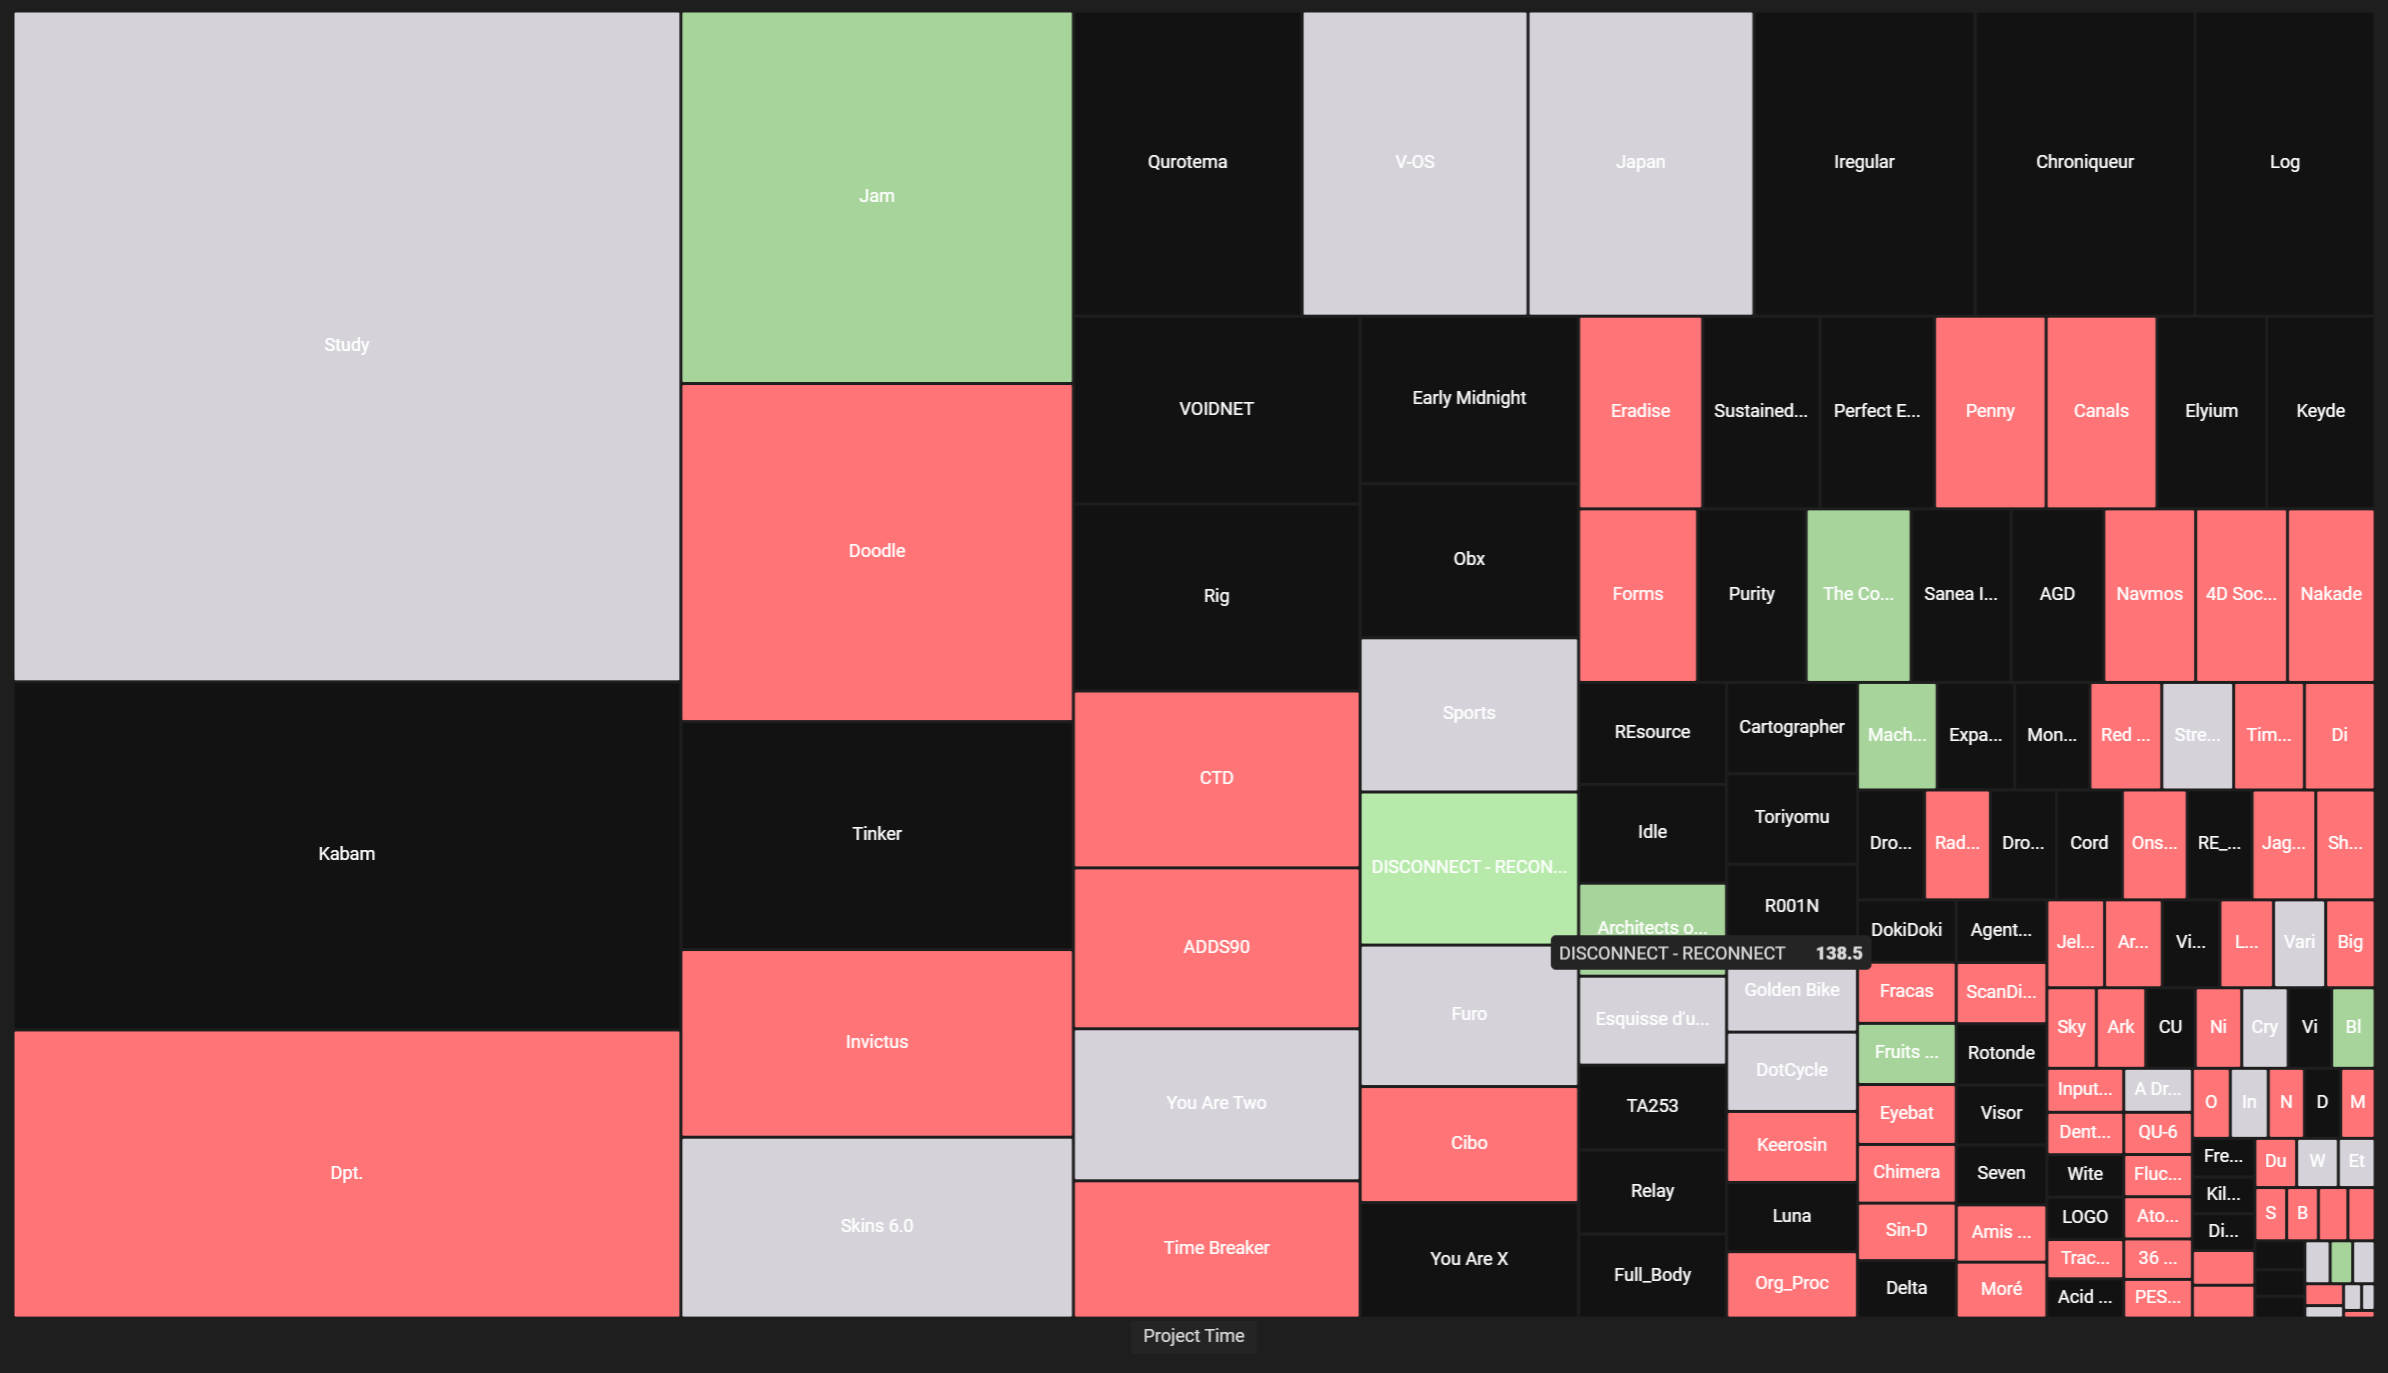
Below are images of what the current obsidian-based visualization interface looks like.
Below are some images showcasing what the old PHP interface looked like, featuring an overview of all log entries and auto-generated pages for projects showing time allocation in different categories of productivity.


